Problem Statement |
| | *TCO competitors must not submit solutions to MM 50. Doing so may result in disqualification.*
A cartographic agency hired you for a project which involves reconstruction of elevation map
of the area from its contour map.
A contour map is a kind of topographic map that portrays
the relief of the area using contour lines which connect points of approximately equal elevation.
As you start working, you find that the map you are given has no notes regarding the values
of elevations or the contour interval (the difference in elevation between successive contour lines)
of the map.
To restore this information, you can request re-measuring of elevations in certain points of the area,
but it is quite expensive, and you want to use as few measurements as possible.
Your task is to reconstruct the elevation map of the area.
Elevation Map Generation
The elevation map is a rectangular array of doubles with W columns and H rows,
each element representing the elevation of the corresponding cell above a certain zero level.
To generate the elevation map, a number of basic points of the relief is chosen between 15 and 25, inclusive.
For each basic point the following parameters are chosen:
-
x-coordinate in [0, W-1],
-
y-cordinate in [0, H-1],
-
elevation z in [0, 99],
-
coefficients f in [100, 199] and w in [0.3, 0.8) (all parameters except for w are integer).
The elevation of a cell (x,y) is calculated as a weighted average of elevations of basic points,
with (sqrt((x-xi)2+(y-yi)2) + fi)-wi
used as weight for basic point i.
Finally, the elevations are scaled: elevation z is replaced with 100*(z-zmin)/(zmax-zmin),
where zmax and zmin are the maximal and minimal elevations before scaling.
Contour Map Generation
The contour map is a rectangular array of '0' and '1' characters (represented with String[])
with W columns and H rows, each element representing black ('1') or white ('0') cell.
To generate the contour map, the contour interval D is chosen between 2.0 and 10.0. Initially all cells of the map are white. For each integer multiple z=D, 2*D, 3*D, ..., we can divide the map into two parts: the cells with elevation less than z and the cells with elevation greater than z. Each cell which has elevation greater than z and has a cell with elevation less than z in its Moore neighborhood is marked as being part of a contour line and painted black.
Each local strict extremum (a cell which is strictly higher or lower than all 8 cells of its Moore neighborhood) is marked by painting the cell of the extremum black and the 4 cells which have a common side with it.
Implementation Details
Your code should implement one method getMap(String[] contourMap).
Parameter contourMap gives you the contour map of the area, contourMap[y][x]
being '1' if the cell at row y and column x was marked as part of a contour line or an extremum, and
'0' otherwise.
You can call the library function Relief.measure(x, y) which returns the elevation of the cell at column x and row y plus a random value sampled from
standard normal distribution.
If adding the random value pushes the elevation below 0 or over 100, it will be adjusted to 0 or 100. Note that for each measurement a new random value is used.
You can do at most floor(sqrt(W*H)) measurements.
Measuring elevation in a cell outside of the area stops the simulation and results in 0 score for
the test case.
You must return your guess for the elevation map of the area as a double[]. The return
must contain exactly W*H elements, with element y*W+x representing
the elevation in the cell at row y and column x.
Scoring
Your score for a test case will be 100-M/floor(sqrt(W*H))/ERR, where M is the number of
measurements done, W and H are x- and y-sizes of the area, and ERR
is the average squared error of your guess (calculated as sum of square(z[y][x]-ret[y*W+x]) over all
cells of the area divided by W*H).
Invalid return of any kind will result in zero absolute score for that test case.
Your overall score will be the sum of YOUR/MAX over all test cases, where YOUR is your score
and MAX is the maximal score achieved by anyone on that test case.
Visualizer
A visualizer is avaliable for offline testing. |
| |
Definition |
| | | Class: | ReliefMap | | Method: | getMap | | Parameters: | String[] | | Returns: | double[] | | Method signature: | double[] getMap(String[] contourMap) | | (be sure your method is public) |
|
| |
|
| |
Notes |
| - | All variables (except for the noise in elevation measurements) are chosen uniformly and randomly. |
| - | For more details on the test case generation and scoring implementation see the visualizer source. |
| - | The memory limit is 1024 MB and the time limit is 10 seconds (which includes only time spent in your code). |
| - | There are 10 example test cases and 100 full submission test cases. |
| |
Constraints |
| - | W and H will be between 50 and 500, inclusive. |
| |
Examples |
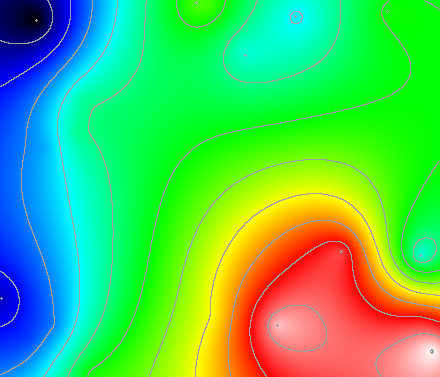
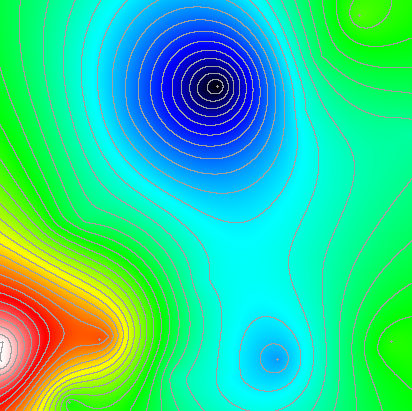
| 0) | |
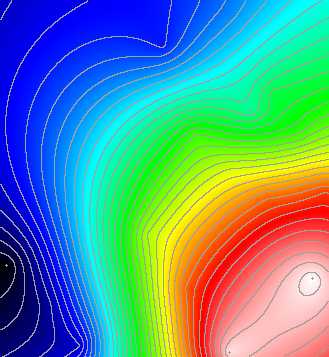
| | | Returns: "seed = 1
W = 440
H = 377
" | |
|
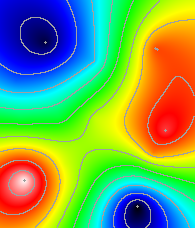
| 1) | |
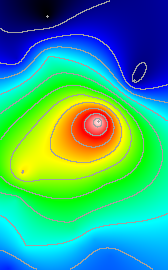
| | | Returns: "seed = 2
W = 195
H = 228
" | |
|
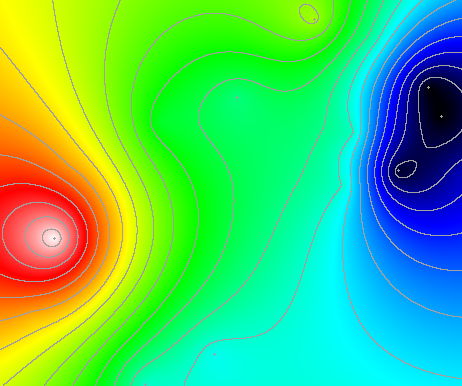
| 2) | |
| | | Returns: "seed = 3
W = 462
H = 386
" | |
|
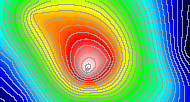
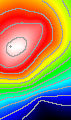
| 3) | |
| | | Returns: "seed = 4
W = 190
H = 102
" | |
|
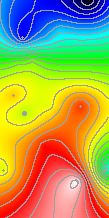
| 4) | |
| | | Returns: "seed = 5
W = 71
H = 120
" | |
|
| 5) | |
| | | Returns: "seed = 6
W = 412
H = 411
" | |
|
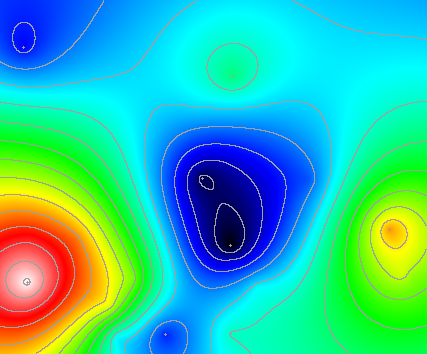
| 6) | |
| | | Returns: "seed = 7
W = 109
H = 218
" | |
|
| 7) | |
| | | Returns: "seed = 8
W = 427
H = 354
" | |
|
| 8) | |
| | | Returns: "seed = 9
W = 329
H = 357
" | |
|
| 9) | |
| | | Returns: "seed = 10
W = 168
H = 270
" | |
|